September 2026
The same intelligence, two years apart
Why I built an open price history for every LLM API, and what it says.
There is a line in Y Combinator’s Request for Startups on AI consumer products that I kept seeing quoted. Raphael Schaad writes that the magic “can run $1,000 a month in tokens for each user, but that is falling 10x a year.”
I believed it. Everyone believes it. But I could not find the chart. Price tables exist — there are half a dozen sites that list what each model costs today. Benchmark leaderboards exist. Nobody had put the two together over time, and without that you cannot actually check the claim, because prices and capability both move. Comparing this year’s flagship to last year’s measures two things at once.
So I built the dataset and checked.
The answer
Hold capability fixed. Pick a bar — say, at least 60% on GPQA Diamond, a graduate-level science benchmark, which is roughly where the original GPT-4 landed. On every date since the benchmark existed, find the cheapest model that clears the bar. Plot its price.
A million tokens at that bar cost $5.25 in September 2024 (o1-mini). In September 2026 it costs $0.055 (qwen3-7-flash, via OpenRouter). That is 95× in two years — about 10× per year.
The number holds.
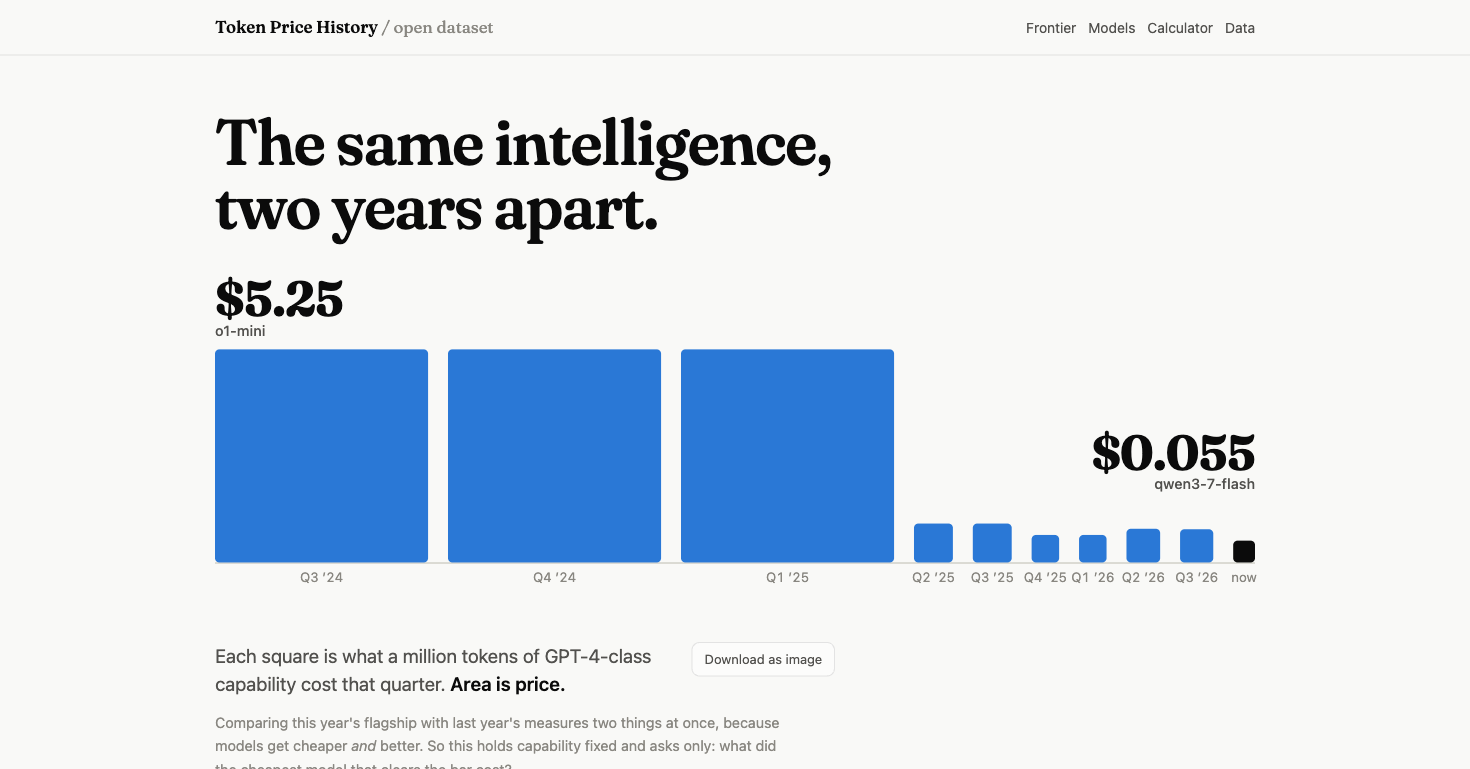
I put the squares at the top of the site because a log-scale chart, which is the honest way to analyse a 95× fall, is the worst way to feel one — its whole job is to flatten magnitude. Area is price. The first square is about a hundred times the last.
The caveats, which are the actual finding
A number like that is only as good as what’s stated next to it. Four things:
The cheapest qualifying model is usually not a first-party API. It’s an open-weight model on a reseller — OpenRouter, Together, Fireworks. Restrict to vendor list prices only and today’s floor at the same bar is about $0.14 (gpt-5-nano), not $0.055. The trend survives; the magnitude shrinks. The site has a toggle for this, and it’s the first thing I’d want a sceptic to click.
It’s one benchmark. GPQA Diamond has the widest coverage of any benchmark with release dates attached, which is why it’s the default. Switch to coding (SWE-Bench Verified) and there are only ~43 models with both a price and a score — too thin to lean on. The selector is there so you can see how thin.
The window is two years because the benchmark is two years old. Prices go back to December 2021 — Davinci was $60 per million tokens — but there is no capability axis to hold fixed that far back. Extrapolating the rate outside 2024–2026 is a guess, not a measurement.
List prices. Nobody at scale pays list.
Where the numbers come from
Two sources, deliberately overlapping so they check each other.
The first is LiteLLM, which maintains a public JSON file of model prices. I replayed its git history — 2,063 commits — into a change log, so every price carries the commit that introduced it. That is the citation: click it and you’re looking at the exact file state the number came from.
The second is the Wayback Machine. Vendor pricing pages have been archived thousands of times; I sampled one snapshot per provider per month, had a model read each page and normalise every quote to dollars per million tokens (per-1k, per-1M, per-character — six years of pages quote all of them), and attached the archive URL to every figure. This is the only source for 2021–2023, and where the two sources overlap, they agree at the seam.
Benchmark scores and release dates are Epoch AI’s own independent runs, CC-BY.
Most of the work was cleaning. A raw replay of the LiteLLM file gives ~15,500 “price changes.” Most aren’t: metadata edits, same-day churn, unit slips (one model was listed at $100,000 per million tokens — a per-thousand figure in a per-million field), typo corrections, and cross-source spikes. Every rule is documented in the README, and every rule is a judgement call you can disagree with.
What survives: 1,475 models, 1,871 real price changes, 225 models joined to scores. Each has its own page. Each price on each page links to its source.
Why it matters
If you’re building a product, the feature that costs too much in tokens today is on a curve. “Uneconomic” is often a scheduling question, not a technical one. The site has a calculator: put in your tokens per user, see what that would have cost on any past date, and what the curve implies going forward.
If you’re choosing a model, the per-model pages show which ones actually got cheaper and which have sat at launch price for a year — and, where a cheaper model now clears the same bar, which one.
And if you’re arguing about this in public, cite the receipt, not the site.
Open the dataset →
Data and code on GitHub
Corrections welcome. If a price is wrong, the link next to it will tell us both which source was wrong.